

Jeremiah Haremza
I am a cross-disciplinary, cross-industry data scientist with a demonstrated ability to deliver valuable insights via data analytics and advanced statistical methods. I have a strong belief that data should lead to not only to understanding, but also drive action.
Skills

Featured Projects

Bank Lending Portfolio
Excel
Created two dashboards in Excel to summarize KPIs and metrics on the performance of the bank's consumer lending portfolio.
Bank Consumer Lending Portfolio | Excel
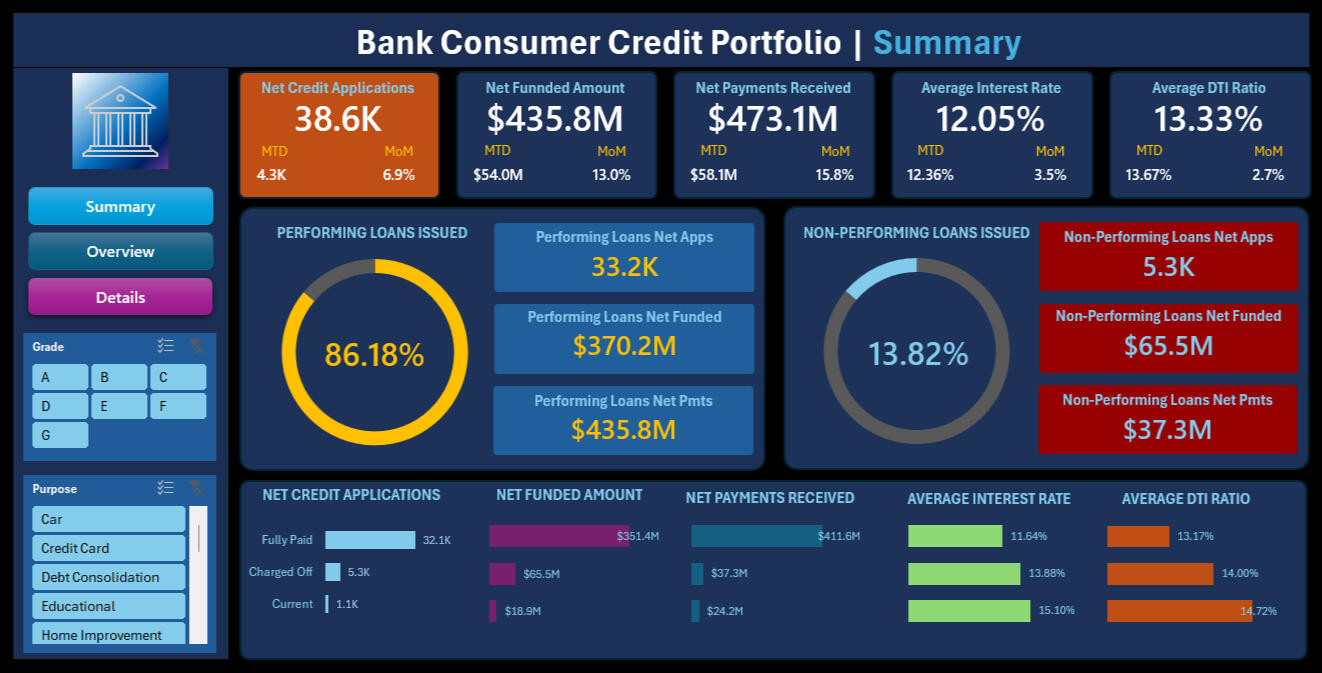
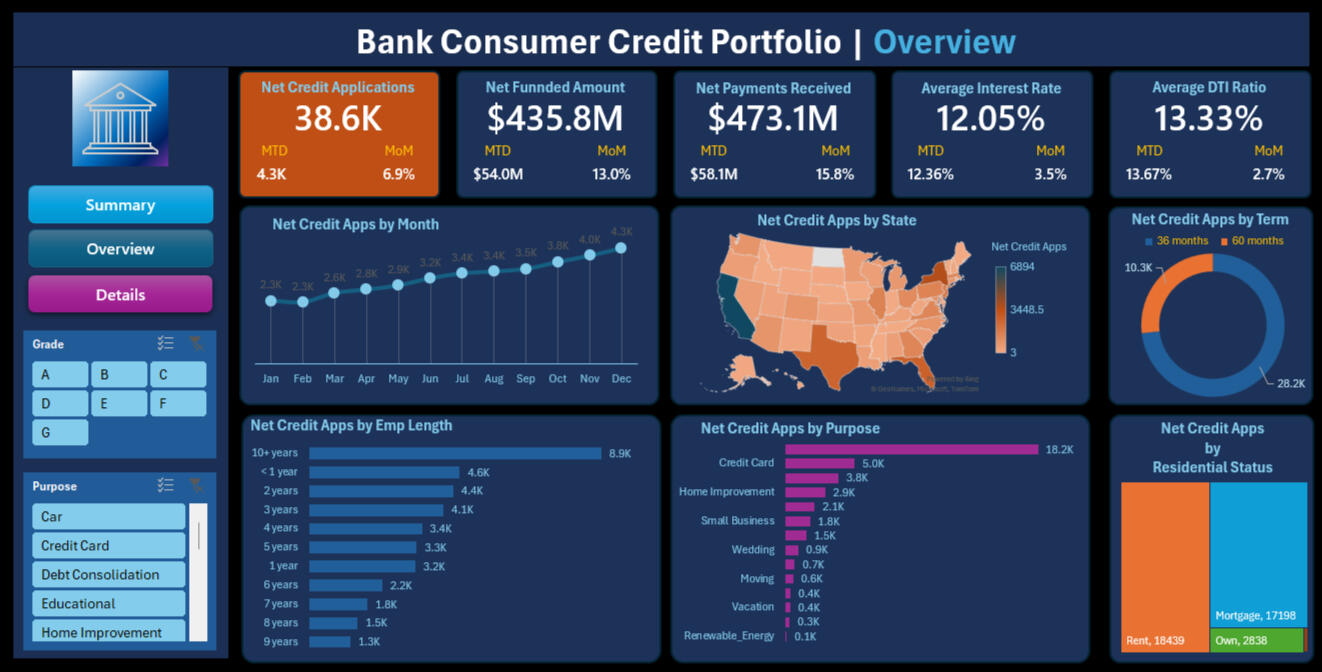
As part of its monthly and year-to-date process, the bank looks at high-level KPIs and metrics to review the performance of its consumer lending portfolio.
Goals, Questions, and Stakeholder Requests
Month-over-month (MoM) and month-to-date (MTD) KPIs requested by stakeholders:
Total Credit Applications
Total Amount Funded
Total Payment Received
Average Interest Rate
Average Debt-to-Income (DTI) Ratio
Questions to Answer:
How are different grades and types of loans performing?
What fraction of credit issued is performing vs. non-performing?
Steps to Create the Analysis
Reviewed requirements, determined appropriate data sources, designed initial draft, and outlined process.
Cleaned and formatted data using Power Query.
Created pivot tables to summarize data over time.
Added additional metrics:
Monthly Trend of Net Applications
Geomapp of Applicants by US State
Loan Term Distribution
Applicant Employment Length
Loan Purpose / Credit Type Distribution
Distribution of Residence Type
Built two dashboard layouts summarizing analysis.
Added navigation buttons to both dashboards.
Added slicers for more granular views of dashboard data.
Key Takeaways from the Analysis
As loan grade decreases, the portion of non-performing loans increases.
Debt consolidation loans are the most issued, accounting for the most significant portion of net payments received at $219M (53%).
Of the 13.8% of loans classified as non-performing, 57% of the funds loaned are recovered.
Loans by geography are aligned to population density, indicating the universality of advertising.
Note: All bank information is fictitious, and no PII has been exposed.